In this article we will explore common types of memory leaks in client-side JavaScript code. We will also learn how to use the Chrome Development Tools to find them. Read on!
Introduction
Memory leaks are a problem every developer has to face eventually. Even when working with memory-managed languages there are cases where memory can be leaked. Leaks are the cause of whole class of problems: slowdowns, crashes, high latency, and even problems with other applications.
What are memory leaks?
In essence, memory leaks can be defined as memory that is not required by an application anymore that for some reason is not returned to the operating system or the pool of free memory. Programming languages favor different ways of managing memory. These ways may reduce the chance of leaking memory. However, whether a certain piece of memory is unused or not is actually an
undecidable problem. In other words, only developers can make it clear whether a piece of memory can be returned to the operating system or not. Certain programming languages provide features that help developers do this. Others expect developers to be completely explicit about when a piece of memory is unused. Wikipedia has good articles on
manual and
automatic memory management.
Memory management in JavaScript
JavaScript is one of the so called garbage collected languages. Garbage collected languages help developers manage memory by periodically checking which previously allocated pieces of memory can still be "reached" from other parts of the application. In other words, garbage collected languages reduce the problem of managing memory from "what memory is still required?" to "what memory can still be reached from other parts of the application?". The difference is subtle, but important: while only the developer knows whether a piece of allocated memory will be required in the future, unreachable memory can be algorithmically determined and marked for return to the OS.
Non-garbage-collected languages usually employ other techniques to manage memory: explicit management, where the developer explicitly tells the compiler when a piece of memory is not required; and reference counting, in which a use count is associated with every block of memory (when the count reaches zero it is returned to the OS). These techniques come with their own trade-offs (and potential causes for leaks).
Leaks in JavaScript
The main cause for leaks in garbage collected languages are unwanted references. To understand what unwanted references are, first we need to understand how a garbage collector determines whether a piece of memory can be reached or not.
Mark-and-sweep
Most garbage collectors use an algorithm known as mark-and-sweep. The algorithm consists of the following steps:
- The garbage collector builds a list of "roots". Roots usually are global variables to which a reference is kept in code. In JavaScript, the "window" object is an example of a global variable that can act as a root. The window object is always present, so the garbage collector can consider it and all of its children to be always present (i.e. not garbage).
- All roots are inspected and marked as active (i.e. not garbage). All children are inspected recursively as well. Everything that can be reached from a root is not considered garbage.
- All pieces of memory not marked as garbage can now be considered garbage. The collector can now free that memory and return it to the OS.
Modern garbage collectors improve on this algorithm in different ways, but the essence is the same: reachable pieces of memory are marked as such and the rest is considered garbage.
Unwanted references are references to pieces of memory that the developer knows he or she won't be needing anymore but that for some reason are kept inside the tree of an active root. In the context of JavaScript, unwanted references are variables kept somewhere in the code that will not be used anymore and point to a piece of memory that could otherwise be freed. Some would argue these are developer mistakes.
So to understand which are the most common leaks in JavaScript, we need to know in which ways references are commonly forgotten.
The Three Types of Common JavaScript Leaks
1: Accidental global variables
One of the objectives behind JavaScript was to develop a language that looked like Java but was permissive enough to be used by beginners. One of the ways in which JavaScript is permissive is in the way it handles undeclared variables: a reference to an undeclared variable creates a new variable inside the global object. In the case of browsers, the global object is window. In other words:
function foo(arg) {
    bar = "this is a hidden global variable";
}
Is in fact:
function foo(arg) {
    window.bar = "this is an explicit global variable";
}
If bar was supposed to hold a reference to a variable only inside the scope of the foo function and you forget to use var to declare it, an unexpected global variable is created. In this example, leaking a simple string won't do much harm, but it could certainly be worse.
Another way in which an accidental global variable can be created is through this:
function foo() {
this.variable = "potential accidental global";
}
foo();
To prevent these mistakes from happening, add 'use strict'; at the beginning of your JavaScript files. This enables a stricter mode of parsing JavaScript that prevents accidental globals.
A note on global variables
Even though we talk about unsuspected globals, it is still the case that much code is littered with explicit global variables. These are by definition noncollectable (unless nulled or reassigned). In particular, global variables used to temporarily store and process big amounts of information are of concern. If you must use a global variable to store lots of data, make sure to null it or reassign it after you are done with it. One common cause for increased memory consumption in connection with globals are
caches). Caches store data that is repeatedly used. For this to be efficient, caches must have an upper bound for its size. Caches that grow unbounded can result in high memory consumption because their contents cannot be collected.
2: Forgotten timers or callbacks
The use of setInterval is quite common in JavaScript. Other libraries provide observers and other facilities that take callbacks. Most of these libraries take care of making any references to the callback unreachable after their own instances become unreachable as well. In the case of setInterval, however, code like this is quite common:
var someResource = getData();
setInterval(function() {
var node = document.getElementById('Node');
if(node) {
node.innerHTML = JSON.stringify(someResource));
}
}, 1000);
This example illustrates what can happen with dangling timers: timers that make reference to nodes or data that is no longer required. The object represented by node may be removed in the future, making the whole block inside the interval handler unnecessary. However, the handler, as the interval is still active, cannot be collected (the interval needs to be stopped for that to happen). If the interval handler cannot be collected, its dependencies cannot be collected either. That means that someResource, which presumably stores sizable data, cannot be collected either.
For the case of observers, it is important to make explicit calls to remove them once they are not needed anymore (or the associated object is about to be made unreachable). In the past, this used to be particularly important as certain browsers (Internet Explorer 6) were not able to manage cyclic references well (see below for more info on that). Nowadays, most browsers can and will collect observer handlers once the observed object becomes unreachable, even if the listener is not explicitly removed. It remains good practice, however, to explicitly remove these observers before the object is disposed. For instance:
var element = document.getElementById('button');
function onClick(event) {
element.innerHtml = 'text';
}
element.addEventListener('click', onClick);
element.removeEventListener('click', onClick);
element.parentNode.removeChild(element);
A note about object observers and cyclic references
Observers and cyclic references used to be the bane of JavaScript developers. This was the case due to a bug (or design decision) in Internet Explorer's garbage collector. Old versions of Internet Explorer could not detect cyclic references between DOM nodes and JavaScript code. This is typical of an observer, which usually keeps a reference to the observable (as in the example above). In other words, every time an observer was added to a node in Internet Explorer, it resulted in a leak. This is the reason developers started explicitly removing handlers before nodes or nulling references inside observers. Nowadays, modern browsers (including Internet Explorer and Microsoft Edge) use modern garbage collection algorithms that can detect these cycles and deal with them correctly. In other words, it is not strictly necessary to call removeEventListener before making a node unreachable.
Frameworks and libraries such as jQuery do remove listeners before disposing of a node (when using their specific APIs for that). This is handled internally by the libraries and makes sure that no leaks are produced, even when run under problematic browsers such as the old Internet Explorer.
3: Out of DOM references
Sometimes it may be useful to store DOM nodes inside data structures. Suppose you want to rapidly update the contents of several rows in a table. It may make sense to store a reference to each DOM row in a dictionary or array. When this happens, two references to the same DOM element are kept: one in the DOM tree and the other in the dictionary. If at some point in the future you decide to remove these rows, you need to make both references unreachable.
var elements = {
button: document.getElementById('button'),
image: document.getElementById('image'),
text: document.getElementById('text')
};
function doStuff() {
image.src = 'http://some.url/image';
button.click();
console.log(text.innerHTML);
}
function removeButton() {
document.body.removeChild(document.getElementById('button'));
}
An additional consideration for this has to do with references to inner or leaf nodes inside a DOM tree. Suppose you keep a reference to a specific cell of a table (a <td> tag) in your JavaScript code. At some point in the future you decide to remove the table from the DOM but keep the reference to that cell. Intuitively one may suppose the GC will collect everything but that cell. In practice this won't happen: the cell is a child node of that table and children keep references to their parents. In other words, the reference to the table cell from JavaScript code causes the whole table to stay in memory. Consider this carefully when keeping references to DOM elements.
4: Closures
A key aspect of JavaScript development are closures: anonymous functions that capture variables from parent scopes. Meteor developers
found a particular case in which due to implementation details of the JavaScript runtime, it is possible to leak memory in a subtle way:
var theThing = null;
var replaceThing = function () {
  var originalThing = theThing;
  var unused = function () {
    if (originalThing)
      console.log("hi");
  };
  theThing = {
    longStr: new Array(1000000).join('*'),
    someMethod: function () {
      console.log(someMessage);
    }
  };
};
setInterval(replaceThing, 1000);
This snippet does one thing: every time replaceThing is called, theThing gets a new object which contains a big array and a new closure (someMethod). At the same time, the variable unused holds a closure that has a reference to originalThing (theThing from the previous call to replaceThing). Already somewhat confusing, huh? The important thing is that once a scope is created for closures that are in the same parent scope, that scope is shared. In this case, the scope created for the closure someMethod is shared by unused. unused has a reference to originalThing. Even though unused is never used, someMethod can be used through theThing. And as someMethod shares the closure scope with unused, even though unused is never used, its reference to originalThing forces it to stay active (prevents its collection). When this snippet is run repeatedly a steady increase in memory usage can be observed. This does not get smaller when the GC runs. In essence, a linked list of closures is created (with its root in the form of the theThing variable), and each of these closures' scopes carries an indirect reference to the big array, resulting in a sizable leak.
This is an implementation artifact. A different implementation of closures that can handle this matter is conceivable, as explained in the
Meteor blog post.
Unintuitive behavior of Garbage Collectors
Although Garbage Collectors are convenient they come with their own set of trade-offs. One of those trade-offs is nondeterminism. In other words, GCs are unpredictable. It is not usually possible to be certain when a collection will be performed. This means that in some cases more memory than is actually required by the program is being used. In other cases, short-pauses may be noticeable in particularly sensitive applications. Although nondeterminism means one cannot be certain when a collection will be performed, most GC implementations share the common pattern of doing collection passes during allocation. If no allocations are performed, most GCs stay at rest. Consider the following scenario:
- A sizable set of allocations is performed.
- Most of these elements (or all of them) are marked as unreachable (suppose we null a reference pointing to a cache we no longer need).
- No further allocations are performed.
In this scenario, most GCs will not run any further collection passes. In other words, even though there are unreachable references available for collection, these are not claimed by the collector. These are not strictly leaks, but still result in higher-than-usual memory usage.
Chrome Memory Profiling Tools Overview
Chrome provides a nice set of tools to profile memory usage of JavaScript code. There two essential views related to memory: the timeline view and the profiles view.
Timeline view
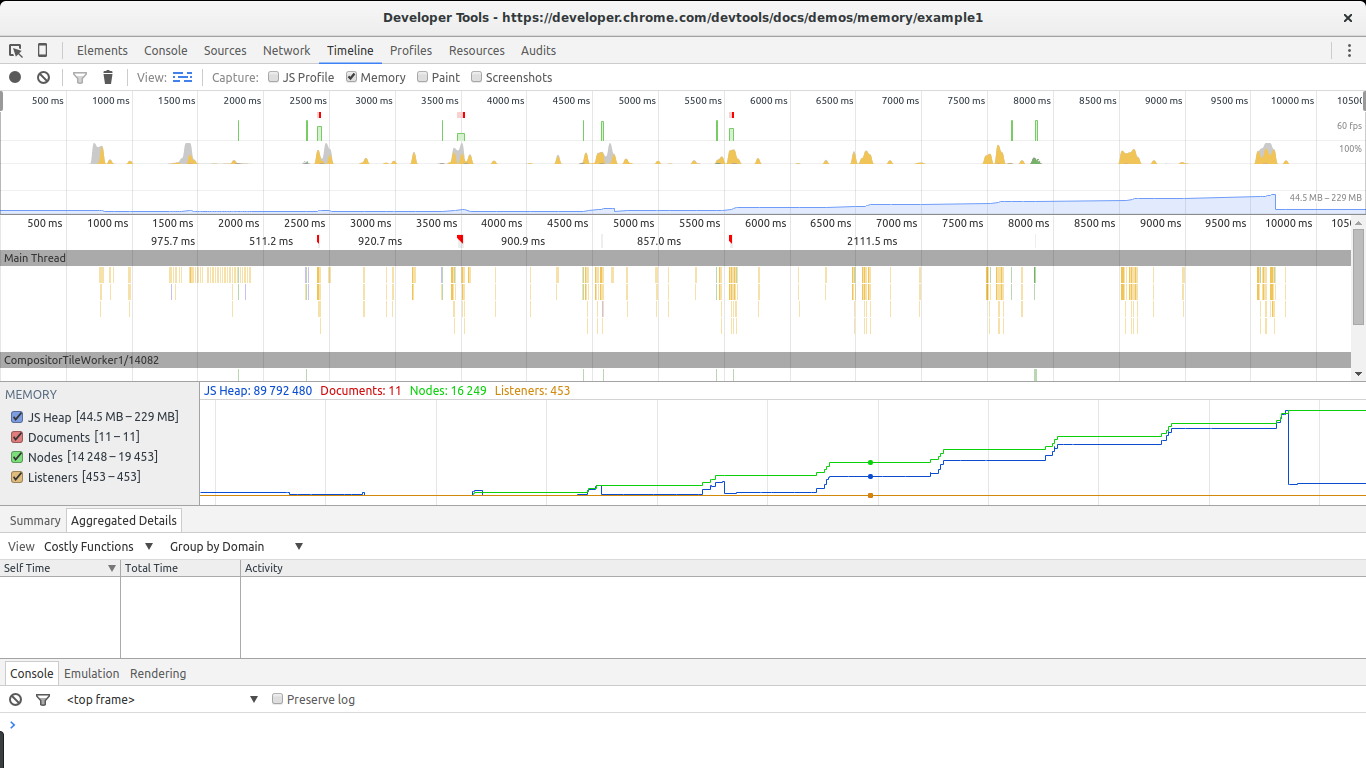
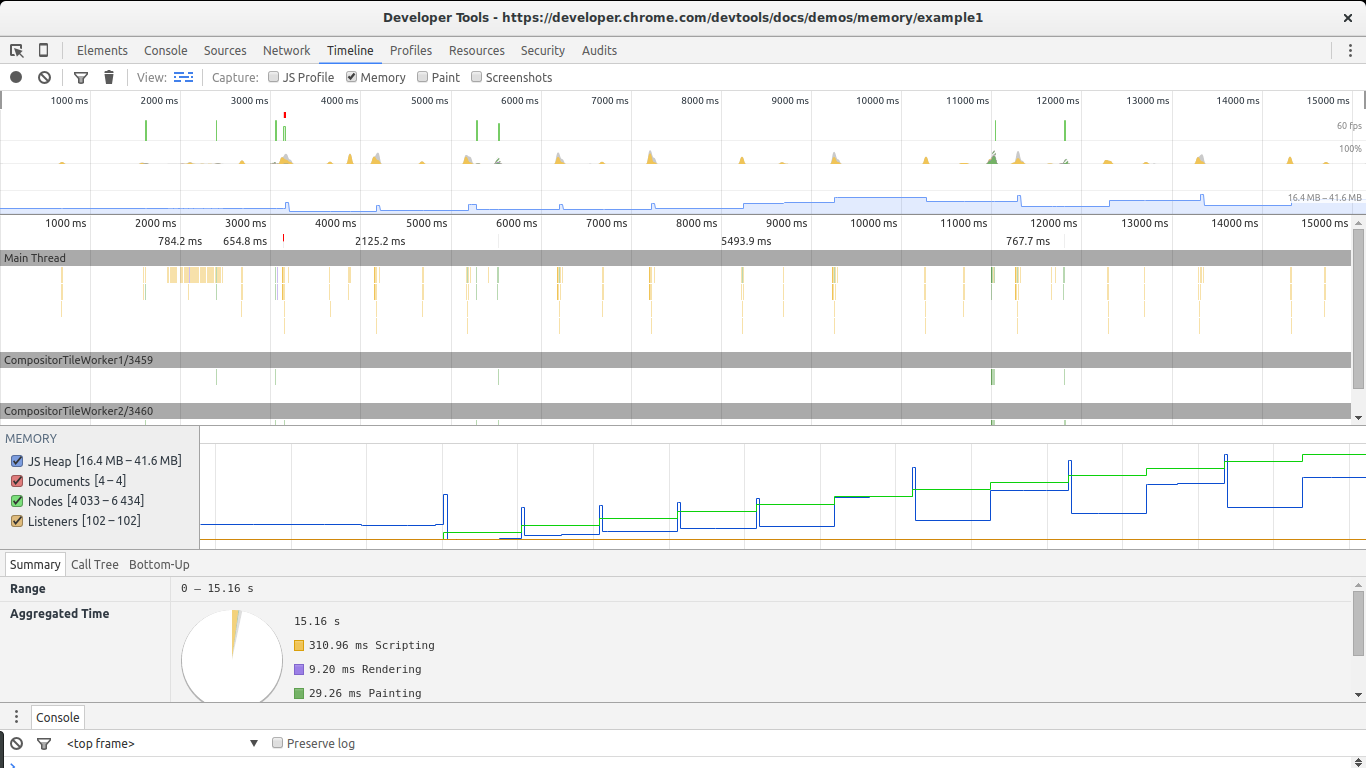
The timeline view is essential in discovering unusual memory patterns in our code. In case we are looking for big leaks, periodic jumps that do not shrink as much as they grew after a collection are a red flag. In this screenshot we can see what a steady growth of leaked objects can look like. Even after the big collection at the end, the total amount of memory used is higher than at the beginning. Node counts are also higher. These are all signs of leaked DOM nodes somewhere in the code.
Profiles view
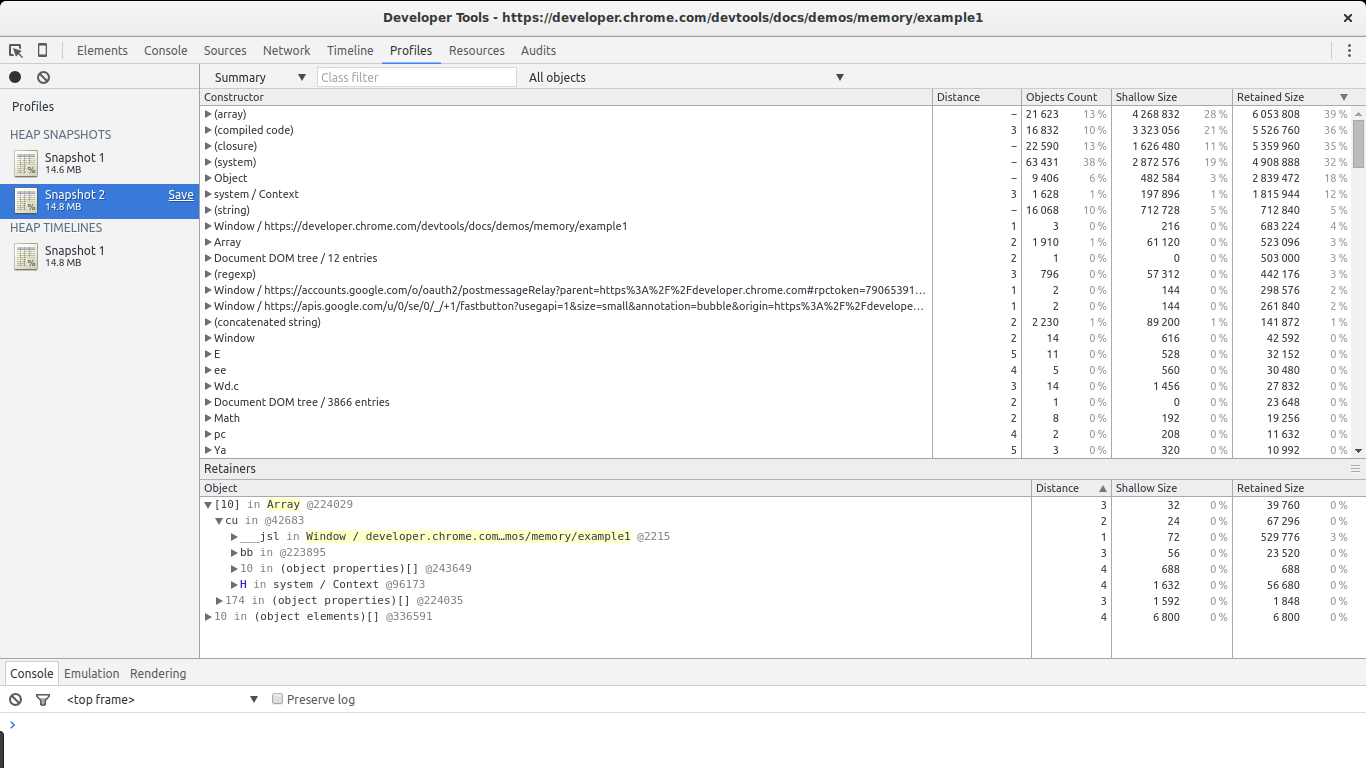
This is the view you will spend most of the time looking at. The profiles view allows you to get a snapshot and compare snapshots of the memory use of your JavaScript code. It also allows you to record allocations along time. In every result view different types of lists are available, but the most relevant ones for our task are the summary list and the comparison list.
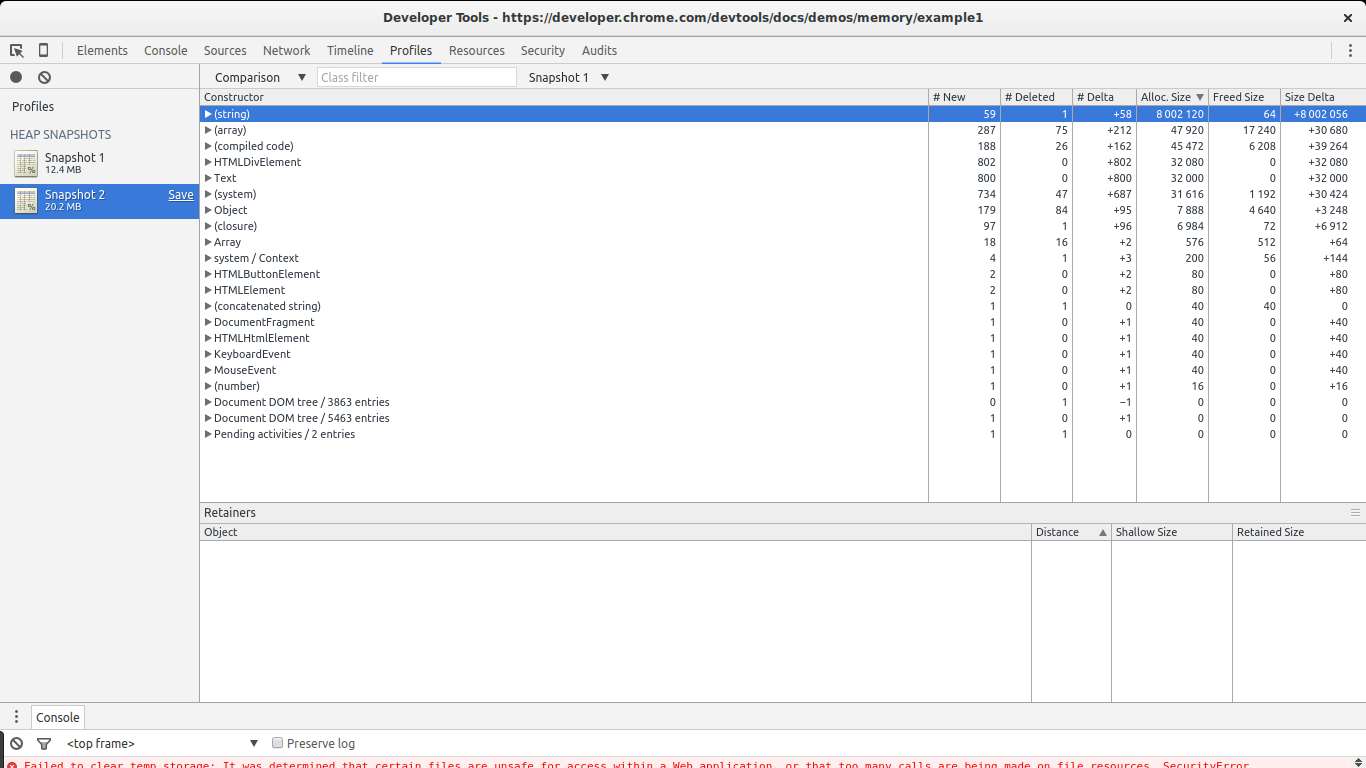
The summary view gives us an overview of the different types of objects allocated and their aggregated size: shallow size (the sum of all objects of a specific type) and retained size (the shallow size plus the size of other objects retained due to this object). It also gives us a notion of how far an object is in relation to its GC root (the distance).
The comparison list gives us the same information but allows us to compare different snapshots. This is specially useful to find leaks.
Example: Finding Leaks Using Chrome
There are essentially two types of leaks: leaks that cause periodic increases in memory use and leaks that happen once and cause no further increases in memory. For obvious reasons, it is easier to find leaks when they are periodic. These are also the most troublesome: if memory increases in time, leaks of this type will eventually cause the browser to become slow or stop execution of the script. Leaks that are not periodic can easily be found when they are big enough to be noticeable among all other allocations. This is usually not the case, so they usually remain unnoticed. In a way, small leaks that are happen once could be considered an optimization issue. However, leaks that are periodic are bugs and must be fixed.
var x = [];

function createSomeNodes() {
    var div,
        i = 100,
        frag = document.createDocumentFragment();
    for (;i > 0; i--) {
        div = document.createElement("div");
        div.appendChild(document.createTextNode(i + " - "+ new Date().toTimeString()));
        frag.appendChild(div);
    }
    document.getElementById("nodes").appendChild(frag);
}
function grow() {
    x.push(new Array(1000000).join('x'));
    createSomeNodes();
    setTimeout(grow,1000);
}
When grow is invoked it will start creating div nodes and appending them to the DOM. It will also allocate a big array and append it to an array referenced by a global variable. This will cause a steady increase in memory that can be found using the tools mentioned above.
Garbage collected languages usually show a pattern of oscillating memory use. This is expected if code is running in a loop performing allocations, which is the usual case. We will be looking for periodic increases in memory that do not fall back to previous levels after a collection.
Find out if memory is periodically increasing
The timeline view is great for this.
Open the example in Chrome, open the Dev Tools, go to
timeline, select
memory and click the record button. Then go to the page and click
The Button to start leaking memory. After a while stop the recording and take a look at the results:
This example will continue leaking memory each second. After stopping the recording, set a breakpoint in the grow function to stop the script from forcing Chrome to close the page.
There are two big signs in this image that show we are leaking memory. The graphs for nodes (green line) and JS heap (blue line). Nodes are steadily increasing and never decrease. This is a big warning sign.
The JS heap also shows a steady increase in memory use. This is harder to see due to the effect of the garbage collector. You can see a pattern of initial memory growth, followed by a big decrease, followed by an increase and then a spike, continued by another drop in memory. The key in this case lies in the fact that after each drop in memory use, the size of the heap remains bigger than in the previous drop. In other words, although the garbage collector is succeeding in collecting a lot of memory, some of it is periodically being leaked.
We are now certain we have a leak. Let's find it.
Get two snapshots
To find a leak we will now go to the profiles section of Chrome's Dev Tools. To keep memory use in a manageable levels, reload the page before doing this step. We will use the Take Heap Snapshot function.
Reload the page and take a heap snapshot right after it finishes loading. We will use this snapshot as our baseline. After that, hit The Button again, wait a few seconds, and take a second snapshot. After the snapshot is taken, it is advisable to set a breakpoint in the script to stop the leak from using more memory.
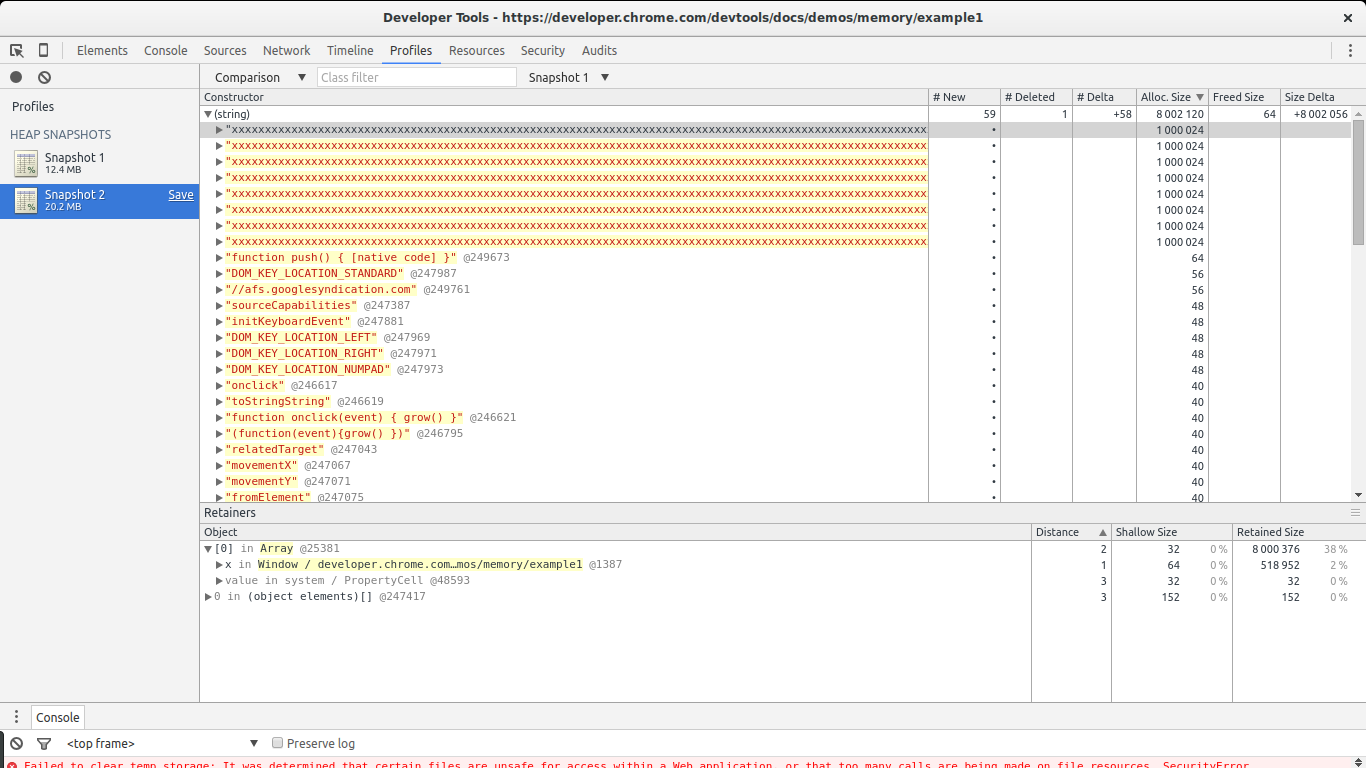
There are two ways in which we can take a look at allocations between the two snapshots. Either select Summary and then to the right pick Objects allocated between Snapshot 1 and Snapshot 2, or select Comparison rather than Summary. In both cases we will see a list of objects that were allocated between the two snapshots.
In this case it is quite easy to find the leaks: they are big. Take a look at the Size Delta of the (string) constructor. 8MBs with 58 new objects. This looks suspicious: new objects are allocated but not freed and 8MBs get consumed.
If we open the list of allocations for the (string) constructor we will notice there are a few big allocations among many small ones. The big ones immediately call our attention. If we select any single one of them we get something interesting in the retainers section below.
We see our selected allocation is part of an array. In turn, the array is referenced by variable x inside the global window object. This gives us a full path from our big object to its noncollectable root (window). We found our potential leak and where it is referenced.
So far so good. But our example was easy: big allocations such as the one in this example are not the norm. Fortunately our example is also leaking DOM nodes, which are smaller. It is easy to find these nodes using the snapshots above, but in bigger sites, things get messier. Recent versions of Chrome provide an additional tool that is best suited for our job: the Record Heap Allocations function.
Recording heap allocations to find leaks
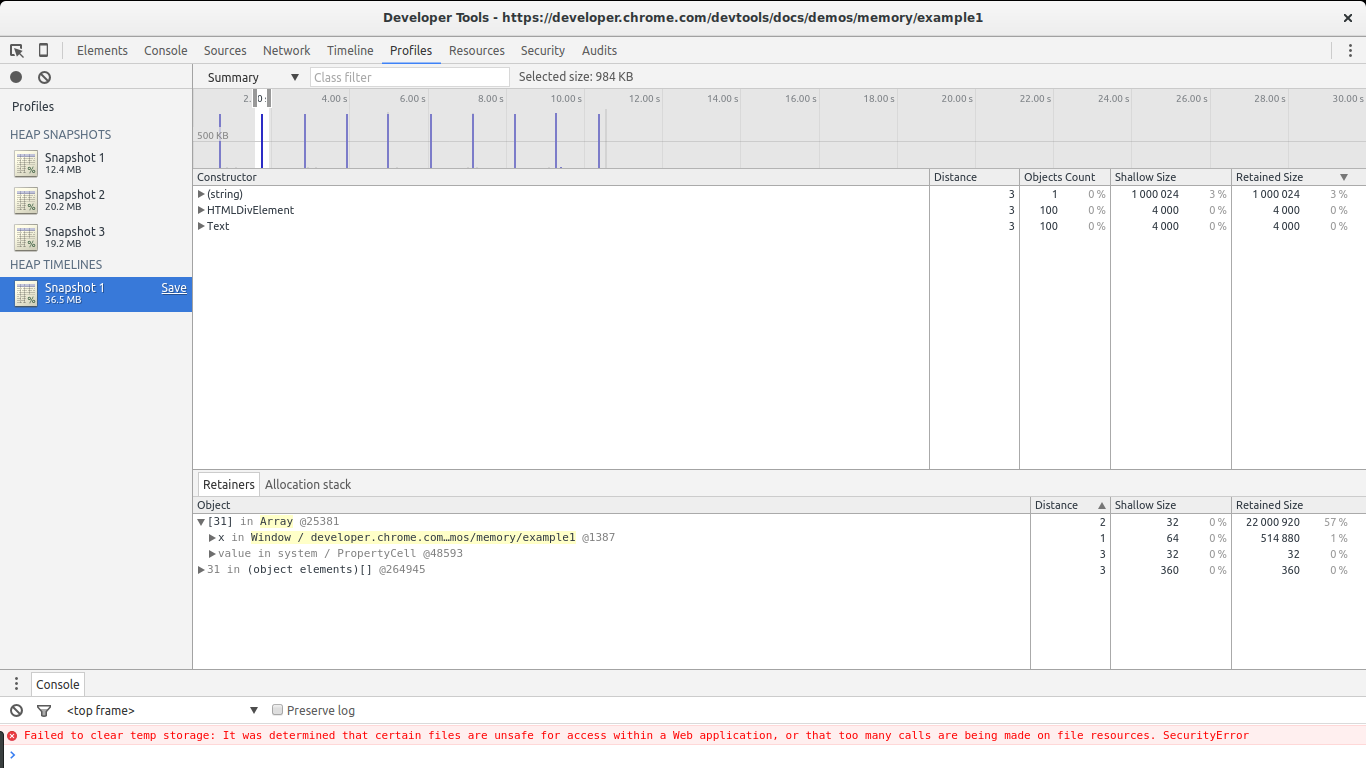
Disable the breakpoint you set before, let the script continue running, and go back to the Profiles section of Chrome's Dev Tools. Now hit Record Heap Allocations. While the tool is running you will notice blue spikes in the graph at the top. These represent allocations. Every second a big allocation is performed by our code. Let it run for a few seconds and then stop it (don't forget to set the breakpoint again to prevent Chrome from eating more memory).
In this image you can see the killer feature of this tool: selecting a piece of the timeline to see what allocations where performed during that time span. We set the selection to be as close to one of the big spikes as possible. Only three constructors are shown in the list: one of them is the one related to our big leaks ((string)), the next one is related to DOM allocations, and the last one is the Text constructor (the constructor for leaf DOM nodes containing text).
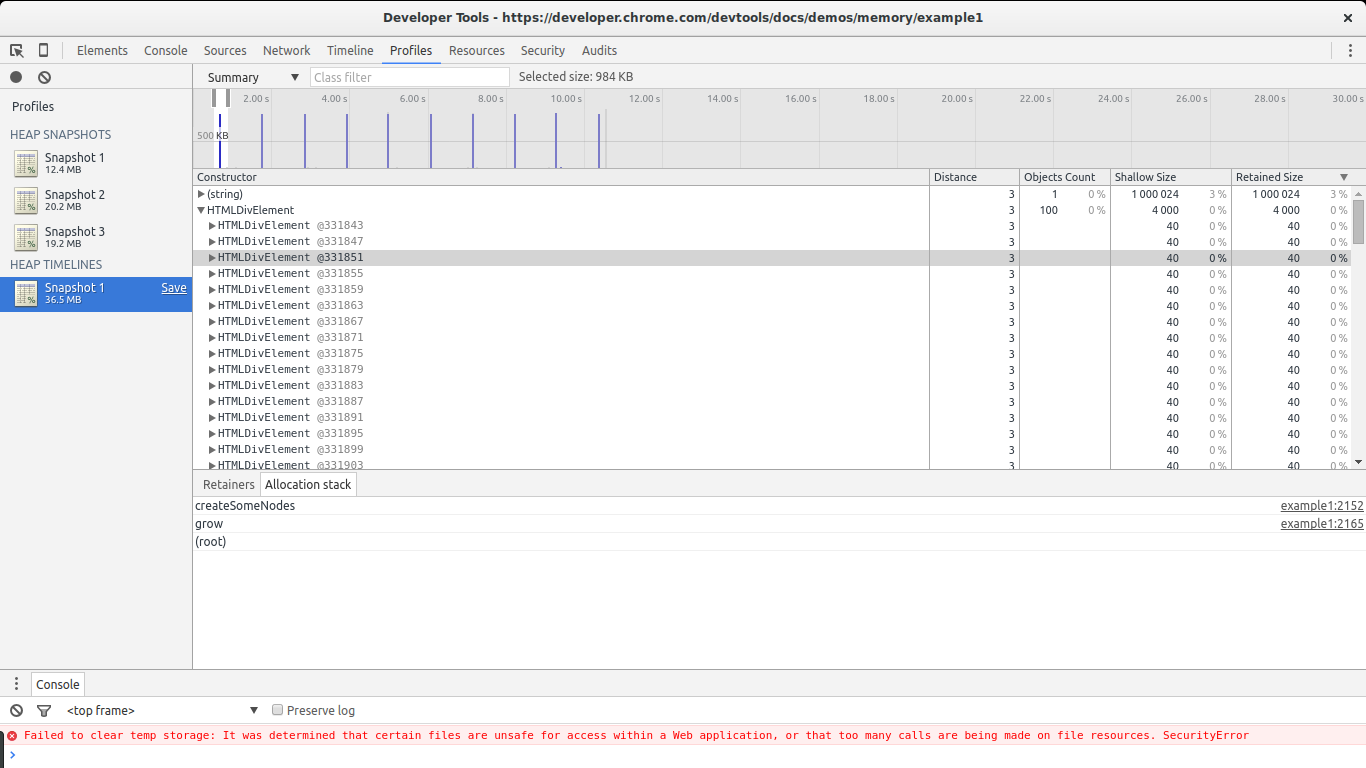
Select one of the HTMLDivElement constructors from the list and then pick Allocation stack.
BAM! We now know where that element was allocated (grow -> createSomeNodes). If we pay close attention to each spike in the graph we will notice that the HTMLDivElement constructor is being called a lot. If we go back to our snapshot comparison view we will notice that this constructor shows many allocations but no deletions. In other words, it is steadily allocating memory without allowing the GC to reclaim some of it. This has all the signs of a leak plus we know exactly where these objects are being allocated (the createSomeNodes function). Now its time to go back to the code, study it, and fix the leaks.
Another useful feature
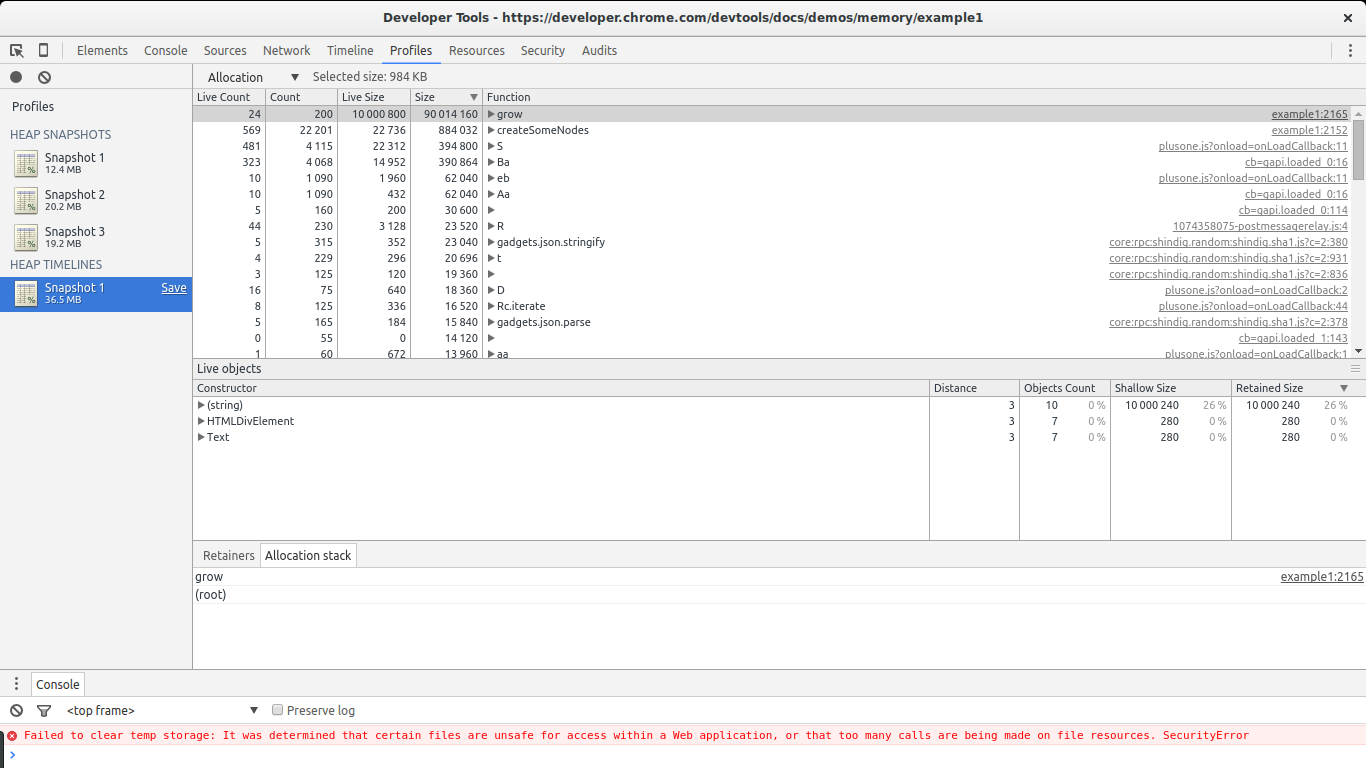
In the heap allocations result view we can select the Allocation view instead of Summary.
This view gives us a list of functions and memory allocations related to them. We can immediately see grow and createSomeNodes standing out. When selecting grow we get a look at the associated object constructors being called by it. We notice (string), HTMLDivElement and Text which by now we already know are the constructors of the objects being leaked.
The combination of these tools can help greatly in finding leaks. Play with them. Do different profiling runs in your production sites (ideally with non-minimized or obfuscated code). See if you can find leaks or objects that are retained more than they should (hint: these are harder to find).
To use this feature go to Dev Tools -> Settings and enable "record heap allocation stack traces". It is necessary to do this before taking the recording.
Further reading
Conclusion
Memory leaks can and do happen in garbage collected languages such as JavaScript. These can go unnoticed for some time, and eventually they will wreak havoc. For this reason, memory profiling tools are essential for finding memory leaks. Profiling runs should be part of the development cycle, especially for mid or big-sized applications. Start doing this to give your users the best possible experience. Hack on!